
Orlando’s housing market is cooler in 2026, but it is not crashing. The market has moved out of the pandemic boom and into a more practical phase where buyers have more choices, sellers need better pricing, and mortgage rates still decide what many families can afford.
The latest Orlando Regional REALTOR® Association data shows a $407,002 median home price in May 2026, with 2,708 sales, 11,531 homes in inventory, 66 average days on market, and 4.26 months of supply. Those numbers point to a market that is more balanced than before, but not weak enough to call it a full buyer’s market.
Buyers now have more room to compare homes, ask for concessions, and avoid rushed decisions. Sellers can still sell, but aggressive pricing is harder to defend. The biggest pressure point is not only the home price. It is the monthly payment after mortgage rates, insurance, property taxes, HOA fees, and maintenance are included.
The best way to describe the 2026 Orlando housing market is balanced, rate-sensitive, and more practical than overheated. Prices are softer than last year, sales improved in spring, and mortgage rates near 6.5% remain the biggest pressure point for both buyers and sellers.
Why Orlando housing feels different in 2026
The Orlando housing story changed because the market is no longer driven by panic buying and extreme scarcity. Inventory is higher, homes sit longer, and buyers are more careful. At the same time, population growth, job demand, and limited affordable inventory keep the market from falling apart.
- Buyers have more options. Inventory reached 11,531 homes in May 2026, far above the tightest years of the market.
- Sellers need realistic pricing. The average home took 66 days to sell in May, which means overpriced listings are easier to spot.
- Mortgage rates still control affordability. A 6.47% rate keeps monthly payments high even when prices soften.
- Distress is still low. Distressed sales made up only 0.4% of May sales, so the data does not show a foreclosure-driven downturn.
Orlando housing market quick stats for May 2026
Here are the main Orlando housing statistics to know right now.
| Metric | Latest number | What it means |
|---|---|---|
| Median home price | $407,002 | Down from April 2026 and below May 2025 |
| Total sales | 2,708 | Up 6.5% from April |
| Inventory | 11,531 homes | More choice than the low-inventory years |
| New listings | 3,787 | Down 7.1% from April |
| Average days on market | 66 days | Homes are taking longer to sell than in the boom years |
| Months of supply | 4.26 months | Below ORRA’s six-month balanced-market marker |
| Mortgage rate | 6.47% | Freddie Mac 30-year fixed rate as of June 18, 2026 |
| Distressed sales | 0.4% of sales | No sign of foreclosure-driven market stress |
Source note. ORRA’s May 2026 report is the main source for local closed-sales data. Freddie Mac is the source for the June 18, 2026 national 30-year fixed mortgage rate.
Orlando home prices in 2026
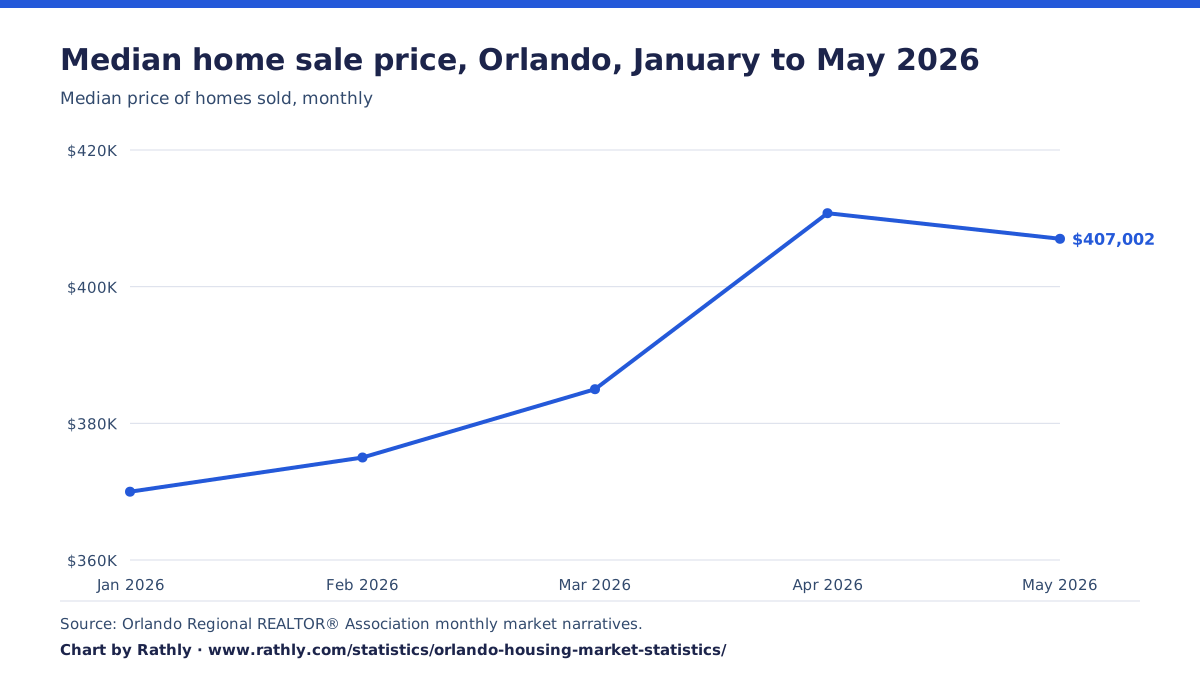
Orlando home prices rose through spring 2026 and then eased slightly in May. The January median price was $370,000. By April, it reached $410,758. In May, it moved down to $407,002.
This does not look like a housing crash. It looks like a market that strengthened after winter, then started to meet affordability limits again as mortgage rates stayed in the mid-6% range. Buyers are still active, but they are more selective than they were during the hottest part of the market.
| Month | Median price |
|---|---|
| January 2026 | $370,000 |
| February 2026 | $375,000 |
| March 2026 | $385,000 |
| April 2026 | $410,758 |
| May 2026 | $407,002 |
Single-family homes vs. condos and townhomes
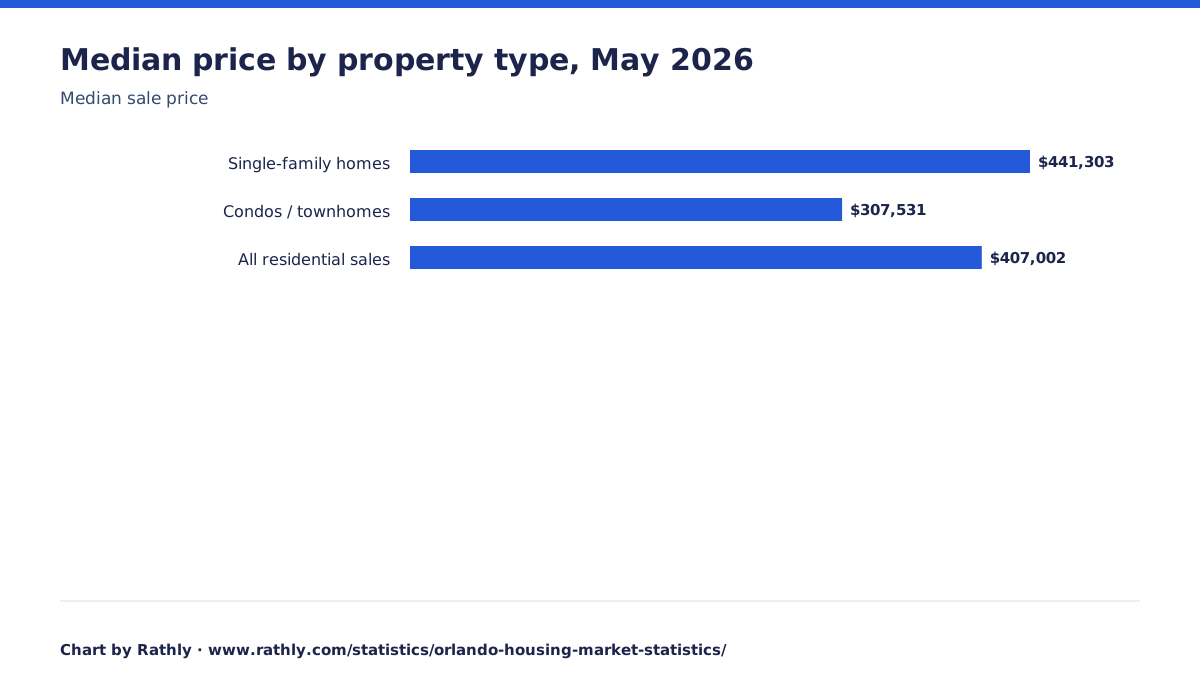
The overall median price does not tell the full story. In May 2026, single-family homes remained much more expensive than condos and townhouses. ORRA reported 2,126 single-family sales at a $441,303 median price. Condos and townhouses had 582 sales at a $307,531 median price.
| Property type | May 2026 sales | Median price | Buyer takeaway |
|---|---|---|---|
| Single-family homes | 2,126 | $441,303 | Higher payment, more competition in desirable locations |
| Condos / townhomes | 582 | $307,531 | Lower entry price, but HOA fees and insurance matter |
| All residential sales | 2,708 | $407,002 | Best headline number for the overall Orlando market |
The condo and townhome number matters for first-time buyers. A lower purchase price can help, but buyers still need to check monthly HOA dues, special assessments, insurance costs, building condition, and rental restrictions. A cheaper purchase price does not always mean a cheaper monthly payment.
Sales, inventory, and months of supply
Inventory is the clearest sign that Orlando has moved away from the extreme seller market. In 2026, buyers have more listings to compare, and homes are taking longer to sell. That gives buyers more time to inspect, negotiate, and compare total monthly costs.
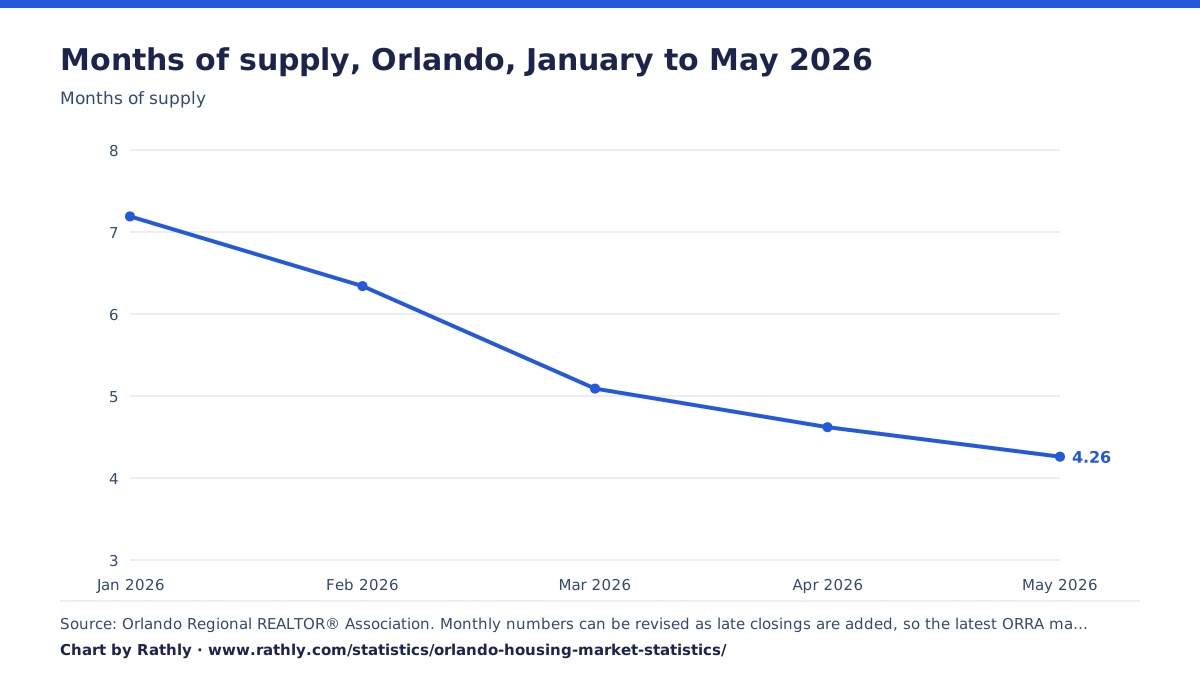
Still, Orlando is not flooded with supply. ORRA reported 4.26 months of supply in May 2026. ORRA uses six months as the benchmark for a balanced market. That means Orlando is more buyer-friendly than before, but it is not a weak market across the board.
| Month | Sales | Inventory | Average days on market | Months of supply |
|---|---|---|---|---|
| January 2026 | 1,634 | 11,741 | 81 | 7.19 |
| February 2026 | 1,888 | 11,975 | 83 | 6.34 |
| March 2026 | 2,360 | 12,010 | 77 | 5.09 |
| April 2026 | 2,542 | 11,750 | 70 | 4.62 |
| May 2026 | 2,708 | 11,531 | 66 | 4.26 |
Metro listing data from Realtor.com and FRED
ORRA is the best source for local closed-sales data. For metro-level listing trends, Realtor.com data through FRED gives another useful view of the Orlando-Kissimmee-Sanford market. In May 2026, the metro had 13,407 active listings, a $419,900 median listing price, and a 70-day median time on market.
These numbers do not perfectly match ORRA because each source uses its own geography, property coverage, and method. That is normal. ORRA is better for local MLS closed-sales data. FRED/Realtor.com is useful for clean metro listing trends over time.
| Realtor.com / FRED metric | Jan 2026 | Feb 2026 | Mar 2026 | Apr 2026 | May 2026 |
|---|---|---|---|---|---|
| Active listing count | 12,494 | 12,760 | 13,089 | 13,218 | 13,407 |
| Median listing price | $415,000 | $415,000 | $419,000 | $419,000 | $419,900 |
| Median days on market | 88 | 82 | 67 | 68 | 70 |
| New listing count | 4,196 | 4,256 | 4,462 | 4,380 | 4,580 |
Median listing price since 2019
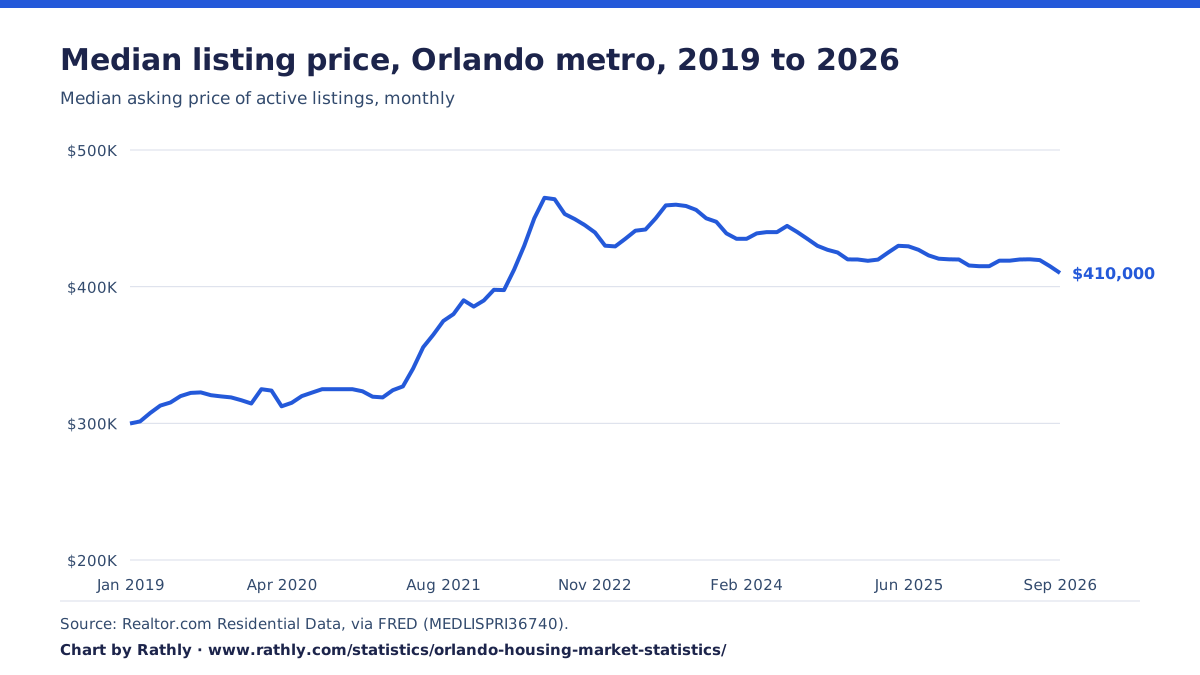
Realtor.com’s monthly series puts the spring of 2026 in context. The Orlando metro’s median listing price rose from $299,900 in January 2019 to a peak of $465,000 in June 2022. It stood at $410,000 in September 2026.
Show the table (93 rows)
| Month | Median listing price |
|---|---|
| September 2026 | $410,000 |
| August 2026 | $415,000 |
| July 2026 | $419,450 |
| June 2026 | $419,990 |
| May 2026 | $419,900 |
| April 2026 | $419,000 |
| March 2026 | $419,000 |
| February 2026 | $415,000 |
| January 2026 | $415,000 |
| December 2025 | $415,495 |
| November 2025 | $419,900 |
| October 2025 | $419,990 |
| September 2025 | $420,475 |
| August 2025 | $422,900 |
| July 2025 | $426,995 |
| June 2025 | $429,573 |
| May 2025 | $429,900 |
| April 2025 | $425,000 |
| March 2025 | $419,800 |
| February 2025 | $418,950 |
| January 2025 | $419,900 |
| December 2024 | $419,950 |
| November 2024 | $425,000 |
| October 2024 | $427,000 |
| September 2024 | $429,931 |
| August 2024 | $435,000 |
| July 2024 | $440,000 |
| June 2024 | $444,473 |
| May 2024 | $439,950 |
| April 2024 | $439,950 |
| March 2024 | $439,000 |
| February 2024 | $435,000 |
| January 2024 | $435,000 |
| December 2023 | $438,995 |
| November 2023 | $447,450 |
| October 2023 | $450,000 |
| September 2023 | $456,195 |
| August 2023 | $458,995 |
| July 2023 | $459,990 |
| June 2023 | $459,450 |
| May 2023 | $450,000 |
| April 2023 | $441,850 |
| March 2023 | $440,948 |
| February 2023 | $434,995 |
| January 2023 | $429,450 |
| December 2022 | $430,000 |
| November 2022 | $439,653 |
| October 2022 | $445,000 |
| September 2022 | $449,411 |
| August 2022 | $453,168 |
| July 2022 | $464,000 |
| June 2022 | $465,000 |
| May 2022 | $450,000 |
| April 2022 | $429,900 |
| March 2022 | $412,500 |
| February 2022 | $397,500 |
| January 2022 | $397,700 |
| December 2021 | $389,900 |
| November 2021 | $385,445 |
| October 2021 | $389,995 |
| September 2021 | $379,950 |
| August 2021 | $374,950 |
| July 2021 | $364,850 |
| June 2021 | $355,698 |
| May 2021 | $340,000 |
| April 2021 | $327,000 |
| March 2021 | $324,263 |
| February 2021 | $319,000 |
| January 2021 | $319,490 |
| December 2020 | $323,410 |
| November 2020 | $325,000 |
| October 2020 | $325,000 |
| September 2020 | $325,000 |
| August 2020 | $325,000 |
| July 2020 | $322,495 |
| June 2020 | $319,950 |
| May 2020 | $315,000 |
| April 2020 | $312,500 |
| March 2020 | $323,950 |
| February 2020 | $325,000 |
| January 2020 | $314,500 |
| December 2019 | $316,924 |
| November 2019 | $319,000 |
| October 2019 | $319,677 |
| September 2019 | $320,591 |
| August 2019 | $322,636 |
| July 2019 | $322,301 |
| June 2019 | $319,900 |
| May 2019 | $315,250 |
| April 2019 | $313,011 |
| March 2019 | $307,580 |
| February 2019 | $301,448 |
| January 2019 | $299,900 |
Orlando vs. the national housing market
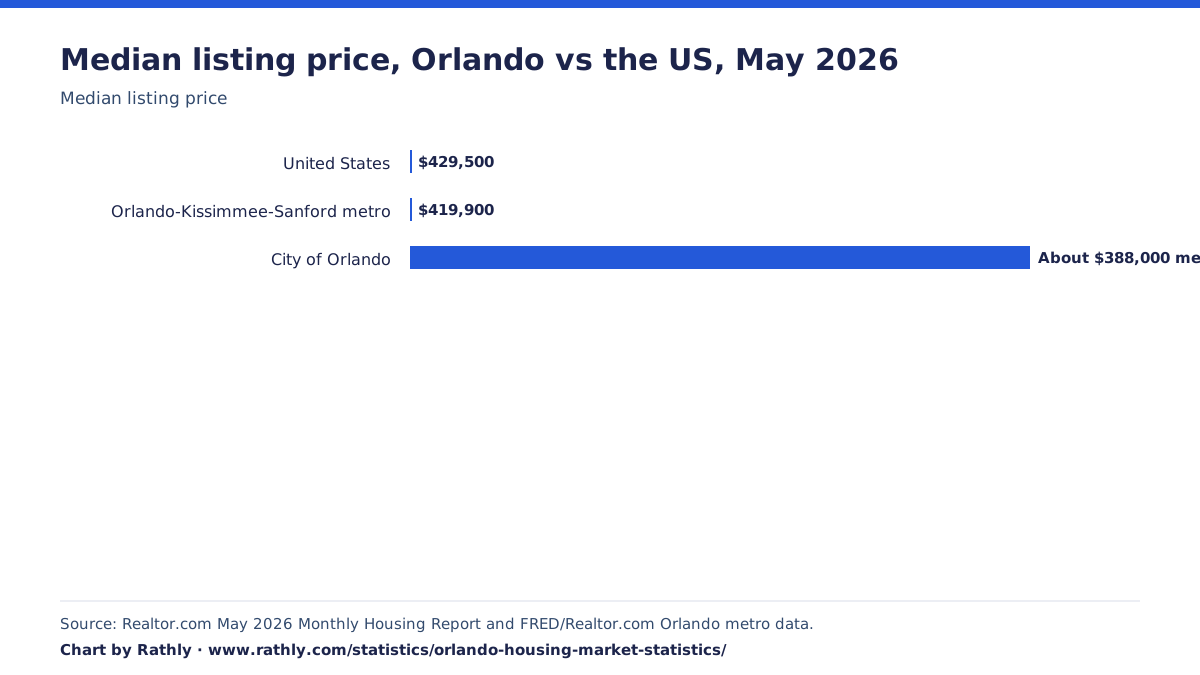
The national housing market also cooled in 2026. Realtor.com reported a national median list price of $429,500 in May 2026, down 2.4% year over year. The Orlando-Kissimmee-Sanford metro median listing price was $419,900 in May, slightly below the national median list price.
That does not mean Orlando is cheap. It means Orlando is no longer priced like the lowest-cost growth markets, but it still sits below many coastal and luxury-heavy markets. The bigger issue for local buyers is the monthly payment, not only the list price.
| Market | May 2026 median listing price | Market note |
|---|---|---|
| United States | $429,500 | National list prices were down year over year |
| Orlando-Kissimmee-Sanford metro | $419,900 | Metro listing price was slightly below the national median list price |
| City of Orlando | About $388,000 median listing price | Realtor.com city-level data showed Orlando as a balanced market in May 2026 |
Mortgage rates are still the main affordability problem
Freddie Mac reported the average 30-year fixed mortgage rate at 6.47% on June 18, 2026. That was lower than the 6.81% rate from one year earlier, but still high compared with the low-rate years that helped fuel the pandemic housing boom.
For buyers, the rate matters as much as the price. At the May 2026 Orlando median price of $407,002, a buyer putting 20% down at 6.47% would have a principal-and-interest payment of about $2,052 per month. That does not include property taxes, insurance, HOA fees, mortgage insurance, utilities, maintenance, or closing costs.
| Purchase example | Price | 20% down | Estimated loan | Estimated principal and interest |
|---|---|---|---|---|
| Overall Orlando median home | $407,002 | $81,400 | $325,602 | About $2,052/month |
| Single-family median home | $441,303 | $88,261 | $353,042 | About $2,225/month |
| Condo / townhome median | $307,531 | $61,506 | $246,025 | About $1,550/month |
Payment estimates use a 30-year fixed mortgage at 6.47% and exclude taxes, insurance, HOA dues, mortgage insurance, and other buyer costs. Source for rate. Freddie Mac Primary Mortgage Market Survey.
City level signals from Redfin, Zillow, and Realtor.com
City-level housing platforms tell a similar story, but the exact numbers differ because each platform uses its own data source and method. Redfin, Zillow, and Realtor.com should not be treated as interchangeable. They are useful as separate market signals.
Redfin’s Orlando city page reported a $406,500 median sale price in May 2026, down 8.1% year over year. Zillow’s Home Value Index for Orlando was around $372,000 in May 2026, down from the prior year. Realtor.com listed Orlando city as a balanced market with an approximate $388,000 median listing price in May 2026.
| Source | Latest Orlando city signal | What it measures best |
|---|---|---|
| Redfin | $406,500 median sale price, May 2026 | Closed-sale price trend for listed homes |
| Zillow | About $372,000 typical home value, May 2026 | Estimated home value index |
| Realtor.com | About $388,000 median listing price, May 2026 | Active listing market conditions |
These sources agree on the main direction. Orlando has cooled from the boom period, but it is not showing a distressed collapse. Prices are softer, listings take longer, and buyers have more leverage than they had a few years ago.
Why Orlando prices are not falling faster
Many buyers expect prices to fall more when inventory rises. That is not always how the market works. Orlando still has population growth, job growth, tourism demand, investor interest, and limited affordable listings. Those forces support demand even when mortgage rates reduce affordability.
Another reason prices do not fall faster is seller behavior. Many current owners have low mortgage rates from earlier years. If they do not need to move, they may choose to stay rather than sell into a rate-sensitive market. That keeps some potential listings off the market.
At the same time, buyers have limits. A home may be $20,000 cheaper than last year, but if the monthly payment is still high, affordability remains difficult. That is why 2026 feels frustrating for both sides. Sellers see more inventory and slower sales. Buyers see more listings but still struggle with the total payment.
New construction and building permits
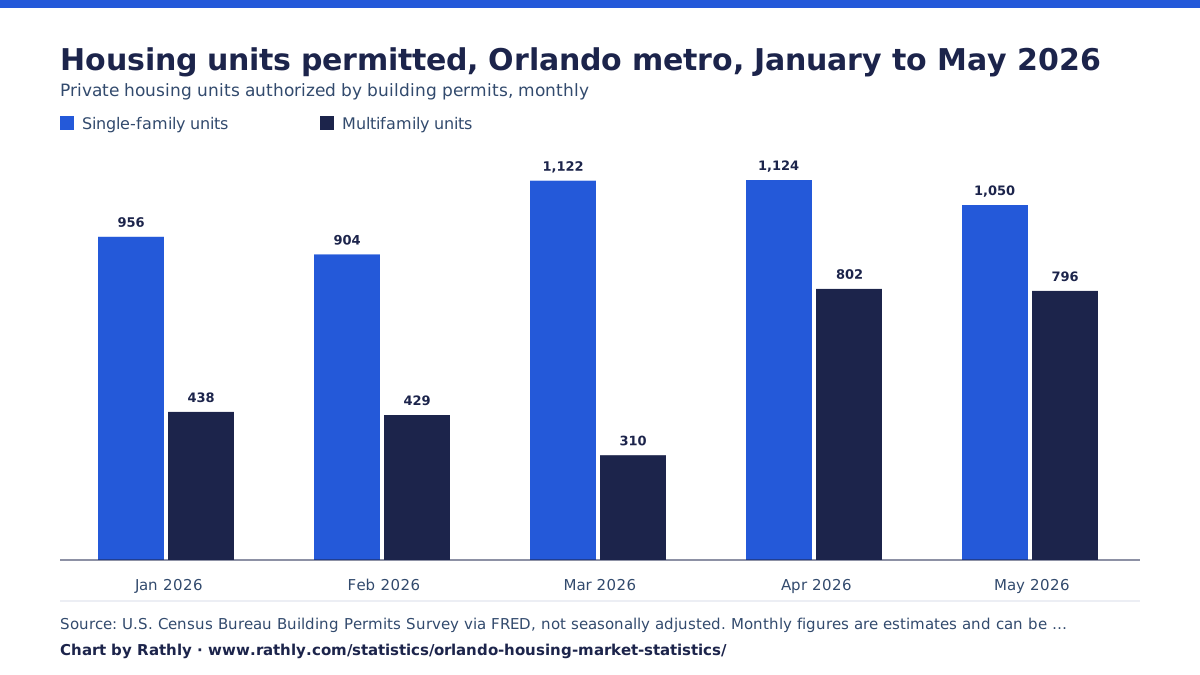
New construction remains part of the Orlando housing story. Census building permit data on FRED shows the Orlando-Kissimmee-Sanford metro permitted 1,846 private housing units in May 2026. That included 1,050 single-family units and 796 units in buildings with two or more homes.
Permits matter because they show future supply, not only today’s active listings. Single-family permits point to future detached-home supply. Multifamily permits point to future rental and attached-housing supply. Both matter in a market where affordability is still a major issue.
| Month | Total units permitted | Single-family units | Multifamily units |
|---|---|---|---|
| January 2026 | 1,394 | 956 | 438 |
| February 2026 | 1,333 | 904 | 429 |
| March 2026 | 1,432 | 1,122 | 310 |
| April 2026 | 1,926 | 1,124 | 802 |
| May 2026 | 1,846 | 1,050 | 796 |
Housing permits per year since 2015
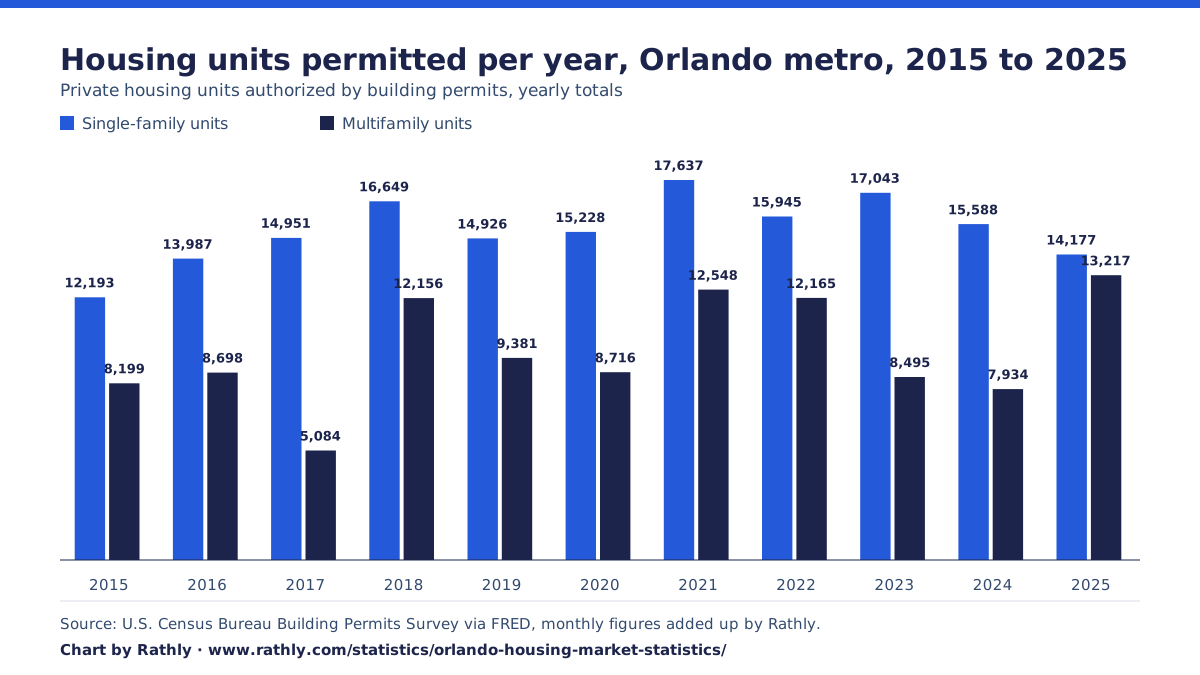
Monthly permits swing with large apartment projects, so yearly totals show the trend better. The metro permitted 27,394 units in 2025, up from 23,522 in 2024. Single-family permits stayed between about 14,000 and 17,600 a year from 2018 to 2025.
| Year | Total units permitted | Single-family units | Multifamily units |
|---|---|---|---|
| 2015 | 20,392 | 12,193 | 8,199 |
| 2016 | 22,685 | 13,987 | 8,698 |
| 2017 | 20,035 | 14,951 | 5,084 |
| 2018 | 28,805 | 16,649 | 12,156 |
| 2019 | 24,307 | 14,926 | 9,381 |
| 2020 | 23,944 | 15,228 | 8,716 |
| 2021 | 30,185 | 17,637 | 12,548 |
| 2022 | 28,110 | 15,945 | 12,165 |
| 2023 | 25,538 | 17,043 | 8,495 |
| 2024 | 23,522 | 15,588 | 7,934 |
| 2025 | 27,394 | 14,177 | 13,217 |
Population growth still supports long-term demand
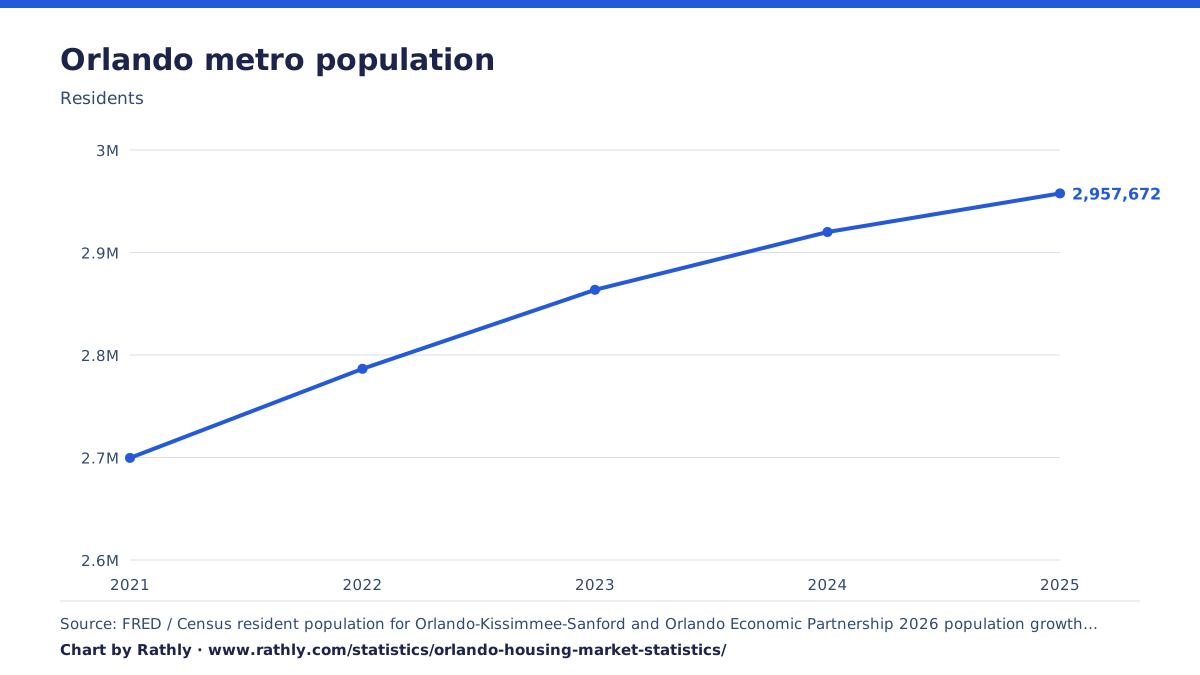
Orlando’s housing market is cooler, but the region is still growing. FRED’s Census-based population series shows the Orlando-Kissimmee-Sanford MSA reached 2,957,672 residents in 2025, up from 2,919,982 in 2024. That means the metro added 37,690 residents in one year.
The Orlando Economic Partnership reported that Orlando ranked among the highest-growth large U.S. regions in the newest Census release. Population growth does not guarantee rising home prices every month, but it does support long-term housing demand, especially when growth continues across Orange, Osceola, Lake, and Seminole counties.
| Year | Orlando MSA population |
|---|---|
| 2021 | 2,699,589 |
| 2022 | 2,786,534 |
| 2023 | 2,863,651 |
| 2024 | 2,919,982 |
| 2025 | 2,957,672 |
What this means for Orlando buyers
Buyers have more leverage in 2026 than they had during the hottest years of the market. More inventory and longer days on market give buyers time to compare listings, request repairs, ask for closing cost help, and avoid panic offers.
That does not mean buying is easy. Mortgage rates, insurance, HOA dues, property taxes, and maintenance can make the monthly payment much higher than the list price suggests. Buyers should compare the full payment, not only the sale price.
- Compare monthly payment, taxes, insurance, HOA fees, and maintenance before making an offer.
- Watch homes that have been on the market longer than the local average.
- Ask about seller credits, repairs, rate buydowns, and closing cost help when the listing has been sitting.
- Be careful with condos and townhomes where HOA fees or special assessments can change affordability.
What this means for Orlando sellers
Sellers can still sell in 2026, but they need to price more carefully. The days of assuming every listing will get multiple fast offers are over in many parts of the market. Buyers are comparing more homes and are more sensitive to monthly payment.
A realistic price matters more than a high starting price. Homes that are clean, well-presented, fairly priced, and easy to finance still have a better chance of moving. Homes that need work or are priced like the 2021 market may sit longer.
- Price against active competition, not only old comparable sales.
- Watch days on market closely during the first two weeks.
- Use good photos, clear property details, and strong showing access.
- Consider concessions if the home is getting traffic but no offers.
Orlando-area markets buyers compare in 2026
Many buyers do not only compare Orlando city. They compare the wider metro area. Depending on budget, commute, schools, lifestyle, and work location, they may look at Winter Garden, Clermont, Kissimmee, St. Cloud, Sanford, Apopka, Lake Nona, Ocoee, Altamonte Springs, Winter Park, Maitland, or other parts of Orange, Osceola, Lake, and Seminole counties.
This matters because Orlando’s housing market is not one simple market. A neighborhood near downtown may behave differently from a new-build area in Lake County or a suburban resale market in Seminole County. Local supply, price point, schools, HOA fees, commute, and insurance costs can change the buyer pool.
Is Orlando a buyer’s market in 2026
Orlando is more buyer-friendly than it was during the boom, but the answer depends on the definition. ORRA reported 4.26 months of supply in May 2026, while six months is the standard balanced-market reference used in its reporting. That suggests Orlando is not fully in buyer’s market territory by that measure.
At the same time, buyers clearly have more leverage than before. Inventory is higher, days on market are longer, and some sellers are more open to concessions. The market is best described as more balanced and rate-sensitive, not as a deep buyer’s market.
What the 2026 numbers tell us
The 2026 Orlando housing market is neither booming nor crashing. It is adjusting. Prices have softened from last year, inventory is much higher than the tightest period, and homes are taking longer to sell. Buyers have more room to negotiate, but affordability remains difficult because mortgage rates and ownership costs are still high.
The most important takeaway is that Orlando is no longer a market where old assumptions work. Sellers need to price with current competition in mind. Buyers need to calculate the full monthly cost. Investors need to be more careful with insurance, HOA fees, rent assumptions, and holding costs. Local businesses should treat housing affordability as part of the region’s economic story, not only a real estate issue.
For 2026, the best short summary is this. Orlando housing is cooler, more balanced, and more practical than it was during the boom. It is not a collapse. It is a market where numbers matter again.